


By Ted Husveth, Managing Director, Credit Product Manager, Tradeweb
In our last blog post, we examined what a typical portfolio trade on our platform looks like in terms of volume, number of line items, sector diversity and liquidity. Portfolio trades tend to have very high hit and quote rates, demonstrating how clients view these portfolios as one basket of risk. Finally, we drew comparisons with regular RFQ list trades highlighting portfolio trades’ comparatively lower liquidity and larger size.

Ted Husveth, Tradeweb
Accurately characterizing what makes up a portfolio trade has implications on how we estimate volumes within the broader credit market. Since TRACE volumes have remained relatively constant over the past year, it is useful to know what proportion comes from portfolio trades and how it has changed over time.
In this piece, we are going to discuss the methodology we use to estimate the overall size of the portfolio trading market and start to look deeper into the recent trends in the credit markets.
Behavioral Shifts
Flagging portfolio trades in TRACE helps capture behavioral shifts in the overall market. From an investor’s view, portfolio trading growth may signal a shift in behavior across the market towards electronification, efficiency and minimal price impact. From the dealer’s perspective, knowing overall portfolio trading numbers could help better understand their respective market share and hit rates. This data can also feed into pricing algorithms and provide insight into how competitively some portfolios are priced in the market.
Uncovering Data
To estimate the portfolio trading market size, it is important to critically analyze trade data from TRACE and identify what we believe to be a portfolio trade. Since we are seeing more and more portfolio trades on our platform, we can identify exactly what our portfolio trades look like in TRACE and infer what other prints follow the same patterns.
Looking For Clusters
The nature of a portfolio trade means that multiple instruments are traded as part of the same basket. So in order to estimate the size of the market from TRACE, grouping together trades which execute within a short time interval of each other would be the first approximation. We must consider whether bonds are high yield or investment grade as both tend to follow different patterns when traded as a portfolio.
Applying Filters
This initial estimate would incorrectly include spot trades (which tend to happen at specific times of day) and dealer-to-dealer session-based trading as these also occur in small time clusters but should not be counted as portfolio trades. Hence, the first filter we apply is to ignore the clusters that appear at times when these events happen.
What we are left with could also be an overestimate of the market, given that portfolio trades tend to have a certain size and number of line items. Next, we take what we know about the size and structure of the typical portfolio trade and filter out clusters that don’t meet certain minimum size thresholds. By ignoring clusters of trades below a threshold of line items, we can be sure not to miscount standard RFQ lists as portfolio trades. We can also systematically ignore clusters if the average line item size is so small that its unlikely to be an institutional trade.
Adding Back Tradeweb Portfolio Trades
The next step is to simply add back the portfolio trades done on Tradeweb that we know we filtered in the previous step. Due to Tradeweb’s net spotting functionality, we are a significant portion of the TRACE tape around the most popular times for spotting. Given our share in both net spotting and portfolio trading, we are in a unique position to match up trades occurring on our system to trades printed in TRACE. This allows us to adjust any initial parameter-driven scrape of TRACE to a more a refined estimate of the portfolio trading market.
A Growing Portfolio Trading Market
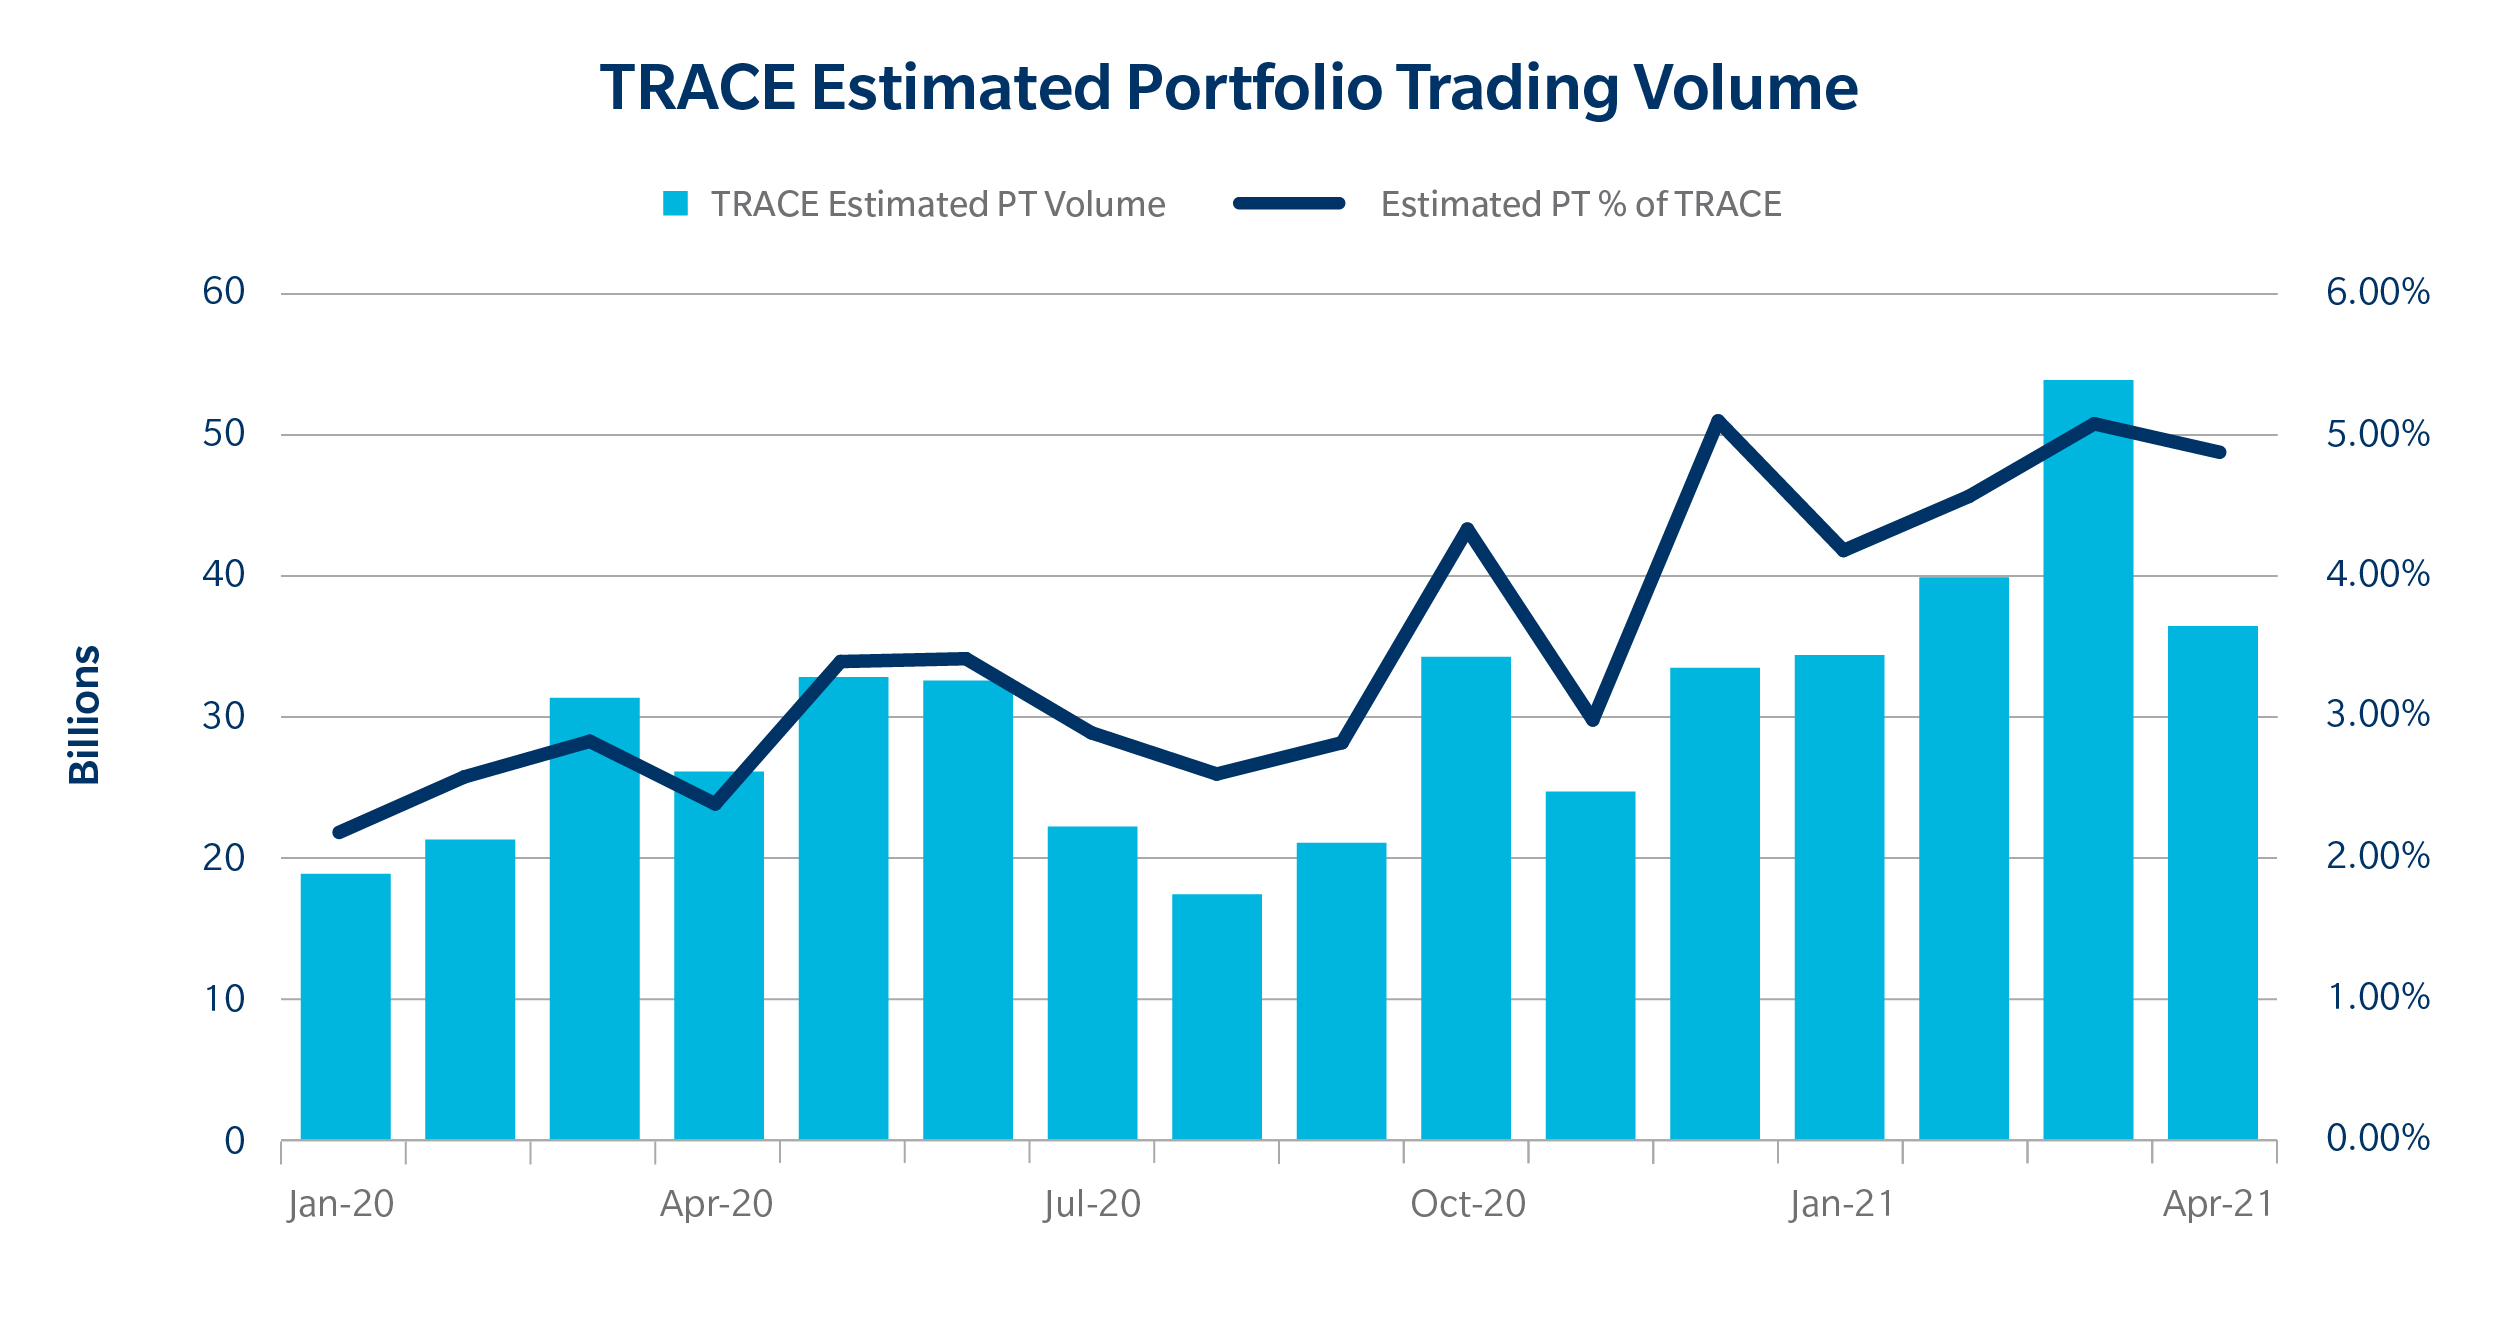
We estimated from TRACE that Q1 2021 was a record quarter in portfolio trading with over $128 billion in volume. This growth is coupled with increased uptake by the market: from Q4 2020 to Q1 2021, there has been a 41% increase in institutional clients and a 25% increase in the number of dealers using Tradeweb’s portfolio trading protocol. This April, even with the decline in TRACE volumes, portfolio trading continues to maintain its share of TRACE volumes at around 5%.
The Larger Growth Story
The growth story in portfolio trading is abundantly clear with PT volumes as a percentage of TRACE more than doubling since the beginning of 2020. While the growth in PT is clearly indicative of changing behavior in the market and a positive response to the liquidity available via the protocol, we also see evidence of increased interest in electronic trading in general.
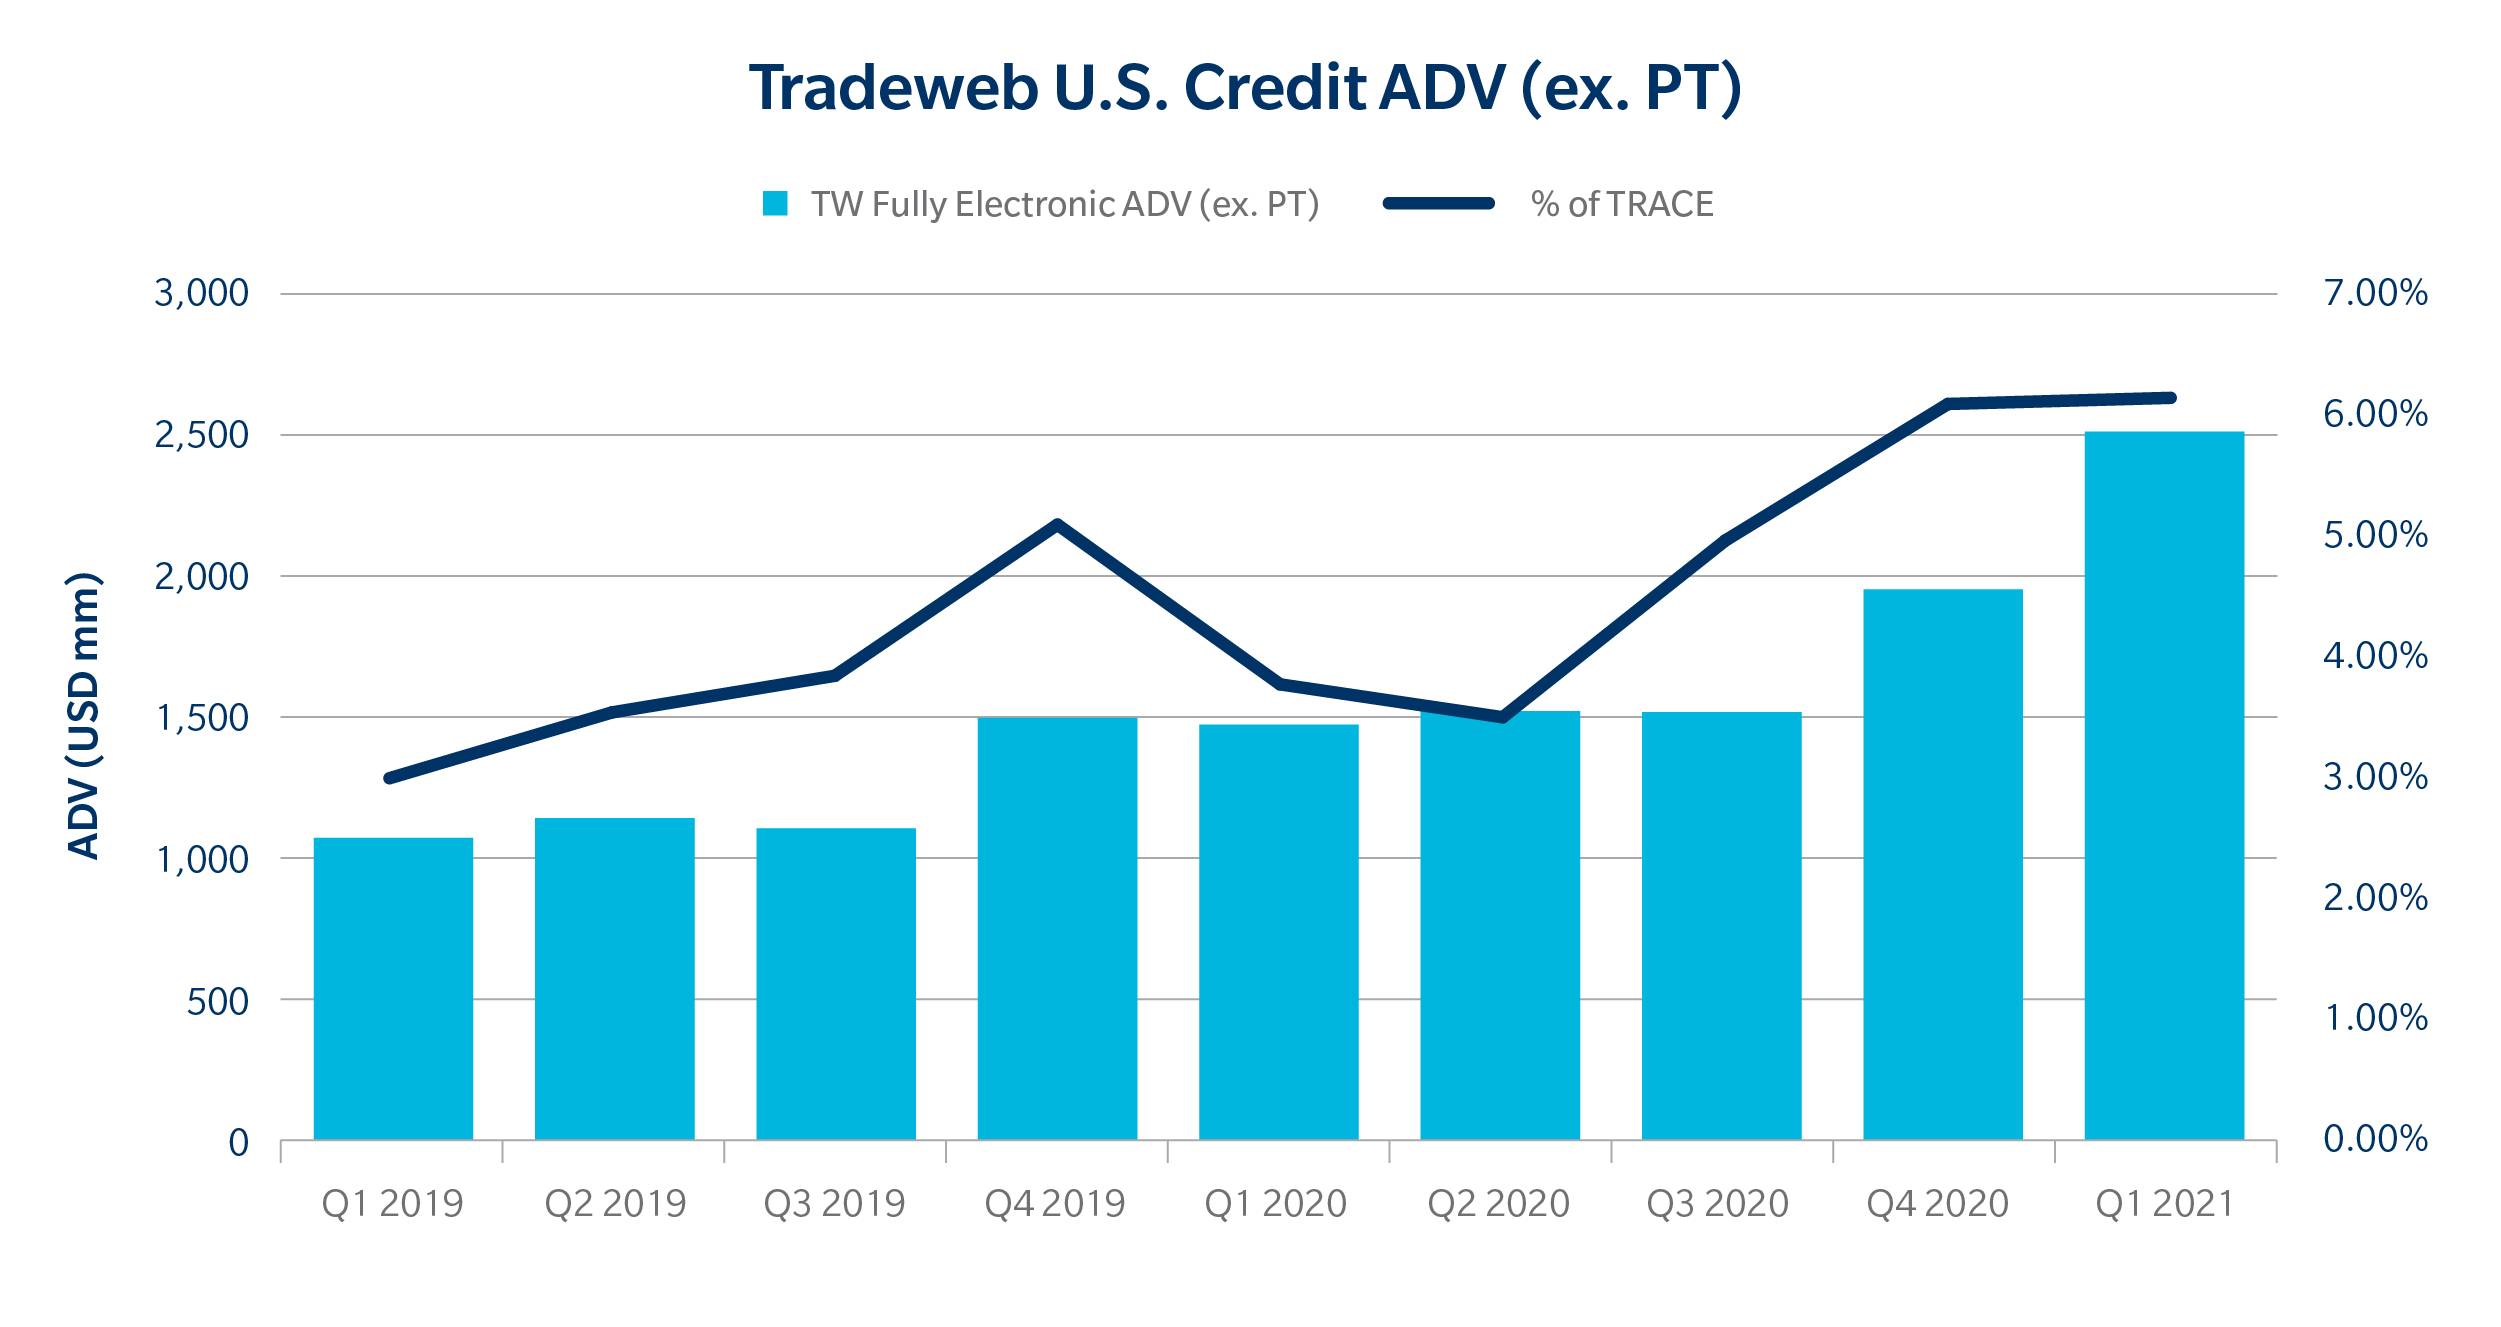
Since Tradeweb released the Portfolio Trading protocol in January 2019, we have seen electronic trading ADV numbers (excluding portfolio trading) on our credit platform grow 130%. Tradeweb is clearly attracting a larger share of the credit market across protocols, and especially RFQ trading – more detail on this is in a future post.
In some respect then, the growth we see in portfolio trading is indicative of a broader uptake of electronic trading in corporate bond markets, though a variety of pull and push factors (such as Tradeweb’s capacity to net spot corporate bond trades, or the particular requirements of a WFH market) come into play. Widespread electronification in fixed income markets is still in its infancy portfolio trading is a key example of how the market – and Tradeweb – is innovating to facilitate trading in this changing market.
In Review
Portfolio Trading continues to be a growth topic within credit markets. Our estimates show that both clients and dealers are continuing their usage of this protocol with portfolio trading volumes reaching around 5% of TRACE. We believe this is part of the broader story in credit as portfolio trading growth has co-existed with the overall growth in electronification. Stay tuned for our next post where we continue to dive into the portfolio trading market.
Click here to learn more about Portfolio Trading.
Source: Tradeweb

NEWSLETTER SIGN UP
And receive exclusive articles on securities markets
As Technology Evolves, Asset Managers Adapt and Innovate
https://www.marketsmedia.com/as-technology-evolves-asset-managers-adapt-and-innovate/
Citi Changes Organizational Structure
https://www.marketsmedia.com/citi-changes-organizational-structure/
SEC Charges Virtu for Disclosures Relating to Information Barriers
https://www.marketsmedia.com/sec-charges-virtu-for-disclosures-relating-to-information-barriers/
ICE Futures Singapore Partners with CoinDesk Indices
https://www.marketsmedia.com/ice-futures-singapore-partners-with-coindesk-indices/
Related articles
-

A physically deliverable futures contract will strengthen the liquidity in EU bond markets.
-

It is the first institutional market to offer electronic portfolio trading for credit & government bonds.
-

The AI-powered analytics platform for debt capital markets will accelerate its expansion into new markets.
-

The new CLOB for cash U.S. Treasuries will be in Chicago next to CME's futures and options markets.
-

OTC Clear will accept international investors' Chinese government bonds in Bond Connect for all derivatives.