


08.28.2014
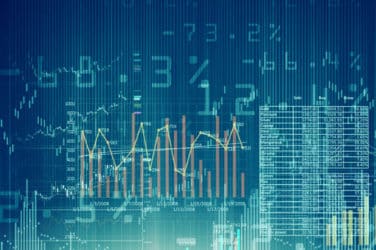
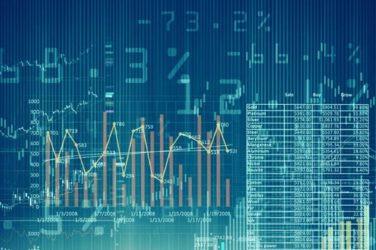
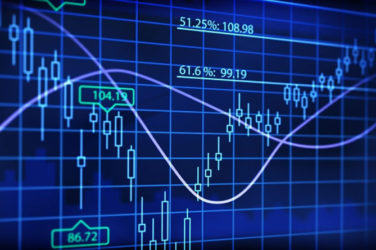
While charts and graphs present immediately consumable data, there are many ways to improve upon the presentation of this information and facilitate quicker realization of a relevant insight.
“Data visualization can show the status of what’s happening, either monitoring a trade or the state of the business, accounts at risk, assets under management growth, performance across portfolio managers, etc.,” Julie Rodriguez, associate creative director at Sapient Global Markets, told Markets Media. “It’s the idea of aggregation and being able to bubble up themes from the data that people are seeing as a better way to manage their day-to-day business and decisions.”
For example, an improved visualization for equity market pricing data was developed in 1998 through a method called “treemapping” in an applet developed by mathematician and artist Martin Wattenberg for SmartMoney.com.
“When Martin Wattenberg introduced Map of the Market, that was a huge break in using a tree/heat map combo within financial markets to show the performance of sectors,” said Rodriguez.
Applying visual solutions to tabular market data can make the realization of relevant insight much more intuitive. Improvements can be made possible through the addition of multiple new dimensions of information or through a simplification of the visual information patterns that are used.
“There are a lot of benefits to data visualizations, and I think that clients are seeing that more and more,” said Rodriguez. “We get a lot of requests for dashboards, which allow you to see data at a quick glance instead of having to go through piles of reports.”
The adoption of data visualization is increasing significantly but not in a universal manner; there are certain types of firms and certain functions within those that are more open to visualization techniques. “I think once it has been proven as an approach we will see a tipping point where visualization becomes the business and industry standard, we’re just not there yet,” Rodriguez said.
Clients in the buy-side institutional space “are the most demanding because they want to see something that offers a significant change to the previous solution,” said Piotr Kaczmarek, associate creative director at Sapient Global Markets. “Once they’ve seen what visualization can achieve they’re open to more adventurous ways of presenting data.”
New areas, like risk management, are opening up to visualization. “This involves taking data related to risk management and regulatory aspects of risk management, and creating something to visualize this type of data in a compelling manner,” said Kaczmarek.
The biggest appetite for visualization is coming from the front office, and some of the visualizations that are being used are attached to technical computer languages like MATLAB, R, or Tableau.
“Data visualizations on the performance-reporting side allow an investor to see how well their assets have performed over the past five or 10 years,” said Rodriguez. “So it’s essentially the ability to consume that type of data through a client portal, in an easily digestible format, particularly as more investors demand the ability to view portfolios via a mobile or tablet device.”
Data visualization enables asset managers to say to clients, “’This is what I did and these are the choices that I made, and this is how it was beneficial to your bottom line,’” said Rodriguez. “Data visualization tools help can make better decisions and they’re also good presentation pieces.”
Featured image via iStock

NEWSLETTER SIGN UP
And receive exclusive articles on securities markets
As Technology Evolves, Asset Managers Adapt and Innovate
Citi Changes Organizational Structure
SEC Charges Virtu for Disclosures Relating to Information Barriers
ICE Futures Singapore Partners with CoinDesk Indices
Terry Flanagan
Managing Editor
Terry Flanagan is Managing Director at Markets Media Group, where he oversees the Markets Media, Traders Magazine, and GlobalTrading platforms....
More about this authorRelated articles
-
TT Splice provides industry-first functionality for synthetic multi-leg spread trading.
-
Modern wheels can incorporate many different data points.
-

Asset managers leave money on the table when using VWAP algos for low-urgency orders.
-

The firm is leveraging its newly acquired quantitative trading expertise to generate new client algorithms.
-
The algo provides an alternative to VWAP for minimizing implementation shortfall.